VO2 testing with Cardio Coach: Interpreting the results
Thu, May 14, 2009 - By Mike Muha
Last week, we looked at the actually experience of being VO2-tested using Cardio Coach, an experience everyone in this year's inaugural CXC Lower Michigan Junior Development and Master Program gets to look forward to. This week, we look at the results from the testing. Although the Cardio Coach produces a rather lengthy set of statistics and graphs, I'm going to focus on one particular graph and the way it's interpreted to determine training intensity zones.
CXC's Yurey Gusiv also provided results from an elite athlete that I'll use for comparison purposes. The two results follow a similar overall pattern but diverge in a number of ways.
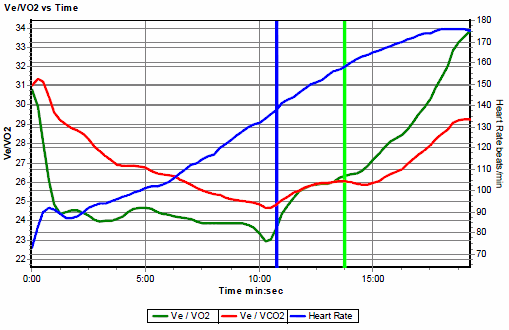
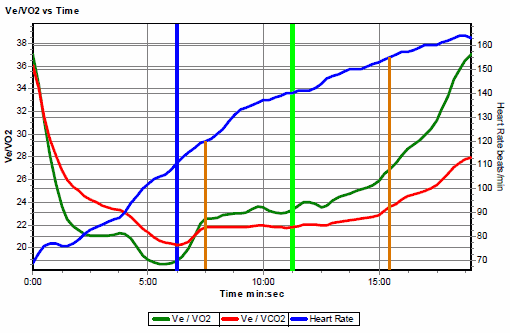
Below are two graphs. The top graph belongs to the elite athlete; the bottom one is mine. Both show Ve/VO2 (green line), Ve/VCO2 (red line), and Heart Rate (blue line) over time. The vertical blue line is the aerobic threshold; the vertical green line shows the anaerobic threshold as determined by the Cardio Coach software.
My graph also includes two vertical orange lines that I drew in - I'll discuss these a little later.
As described in the previous article,
- Ve/VO2 is oxygen consumption divided by the air volume breathed.
- Ve/VCO2 is carbon dioxide production divided by the air volume breathed.
Both graphs have a distinct U-shaped pattern for Ve/VO2 and Ve/VCO2. As effort increases, Ve (the amount of air moved in and out of the lungs) increases more slowly than V02 (oxygen consumption) and VCO2 (carbon dioxide production). As ratio of Ve to VO2 and VCO2 decreases, the line goes down. Notice also that Ve/VO2 is always lower then Ve/VOC2.
Aerobic threshold
Both Ve/VO2 and Ve/VCO2 drop during the first minutes of the test until they bottom out, then start rising. This point corresponds with the intensity beyond which progressive increases in blood lactate occur and is is know as the Aerobic Threshold (AeT). This is the point where you first start taking deeper breaths. One indicator of fitness is how fast you can go without crossing the aerobic threshold.
The elite athlete was almost 11 minutes into the test with a heart rate just under 140 when he crossed AeT. Me? It took a mere six minutes to hit AeT, at a heart rate of 110.
Over the next several minutes, Ve/VO2 and Ve/VCO2 are roughly parallel with each other. For Mr. Elite, they are pretty much equal. For me, Ve/VO2 is always higher. (What does that mean? I'm not sure, but when I find out I'll update this article!)

Cardio Coach results for an elite athlete

Cardio Coach results for Mike Muha - NOT an elite athlete
Anaerobic threshold
The graph distinctly changes again at the point where the lines for Ve/VO2 and Ve/VCO2 diverge, with Ve/VO2 climbing at a faster rate. This point is the Anaerobic Threshold (AT) and is indicated by the vertical green line. This is the point where more anaerobic energy production is required to supplement aerobic energy production, and is identified on the graph as the point where VE/VO2 begins to continuously increase. This is also the point where we would see blood lactate starting to accumulate in the blood.
In order to keep the blood from becoming too acidic, ventilation increases to help us eliminate excess CO2. Ve increases at a higher rate than oxygen consumption and thus the ratio (VE/VO2) begins to increase.
For the Mr. Elite, AT occurs at a heart rate of 158. For me, it's 140.
Setting training intensity zones
From my graph, Yuriy defined five training intensity zones:
Zone |
Heart Rate Range |
Benefit |
Uses |
| 1 | up to 120 | Aerobic efficiency | Distance and recovery |
| 2 | 120-140 | Aerobic efficiency | Distance/technique |
| 3 | 140-155 | Improve lactate metabolism | Threshold/pace training |
| 4 | 155-164 | Increase maximal aerobic capacity | VO2 Max training |
| 5 | All out |
Increase anaerobic capacity |
Not used too much... |
Where did these zones come from? The first vertical orange line on the graph corresponds to the heart rate that divides Zone 1 and 2, or 120 beats per minute. This heart rate is at the point where Ve/VO2 and Ve/VCO2 plateau after rapidly rising from their lowest points.
The vertical green line is at a heart rate of 140, my lactate threshold, and divides Zone 2 from Zone 3.
The final vertical orange line is at 155 beats per minute and divides Zone 3 from Zone 4. Notice the both Ve/VO2 and Ve/VCO2 both "elbow" up at approximately this point.
Zone 5 is not determined from the graph. It is simply a short, all-out sprint.
Using training intensity zones
The zones are defined so you can target your intensity in a training session toward a specific goal.
Zone or Intensity 1 training is where the majority of training occurs for athletes putting in a lot of training hours. Distance training should be at this intensity - medium to long workouts generally at a fairly constant pace. The athlete should get tired from the length of the session NOT the intensity. If you go too hard, you won't have the energy left over for "quality" Zone 3 and Zone 4 sessions later. Zone 1 training produces long-term structural changes to the heart, lungs and muscle.
Zone 2 intensity happens typically when you're working on new technique or when you're in difficult terrain and need to go harder to maintain your technique. Sessions in Zone 2 should be relatively short; you might go into Zone 2 for a short period when you climb a steep hill during a long Zone 1 session. The intensity in Zone 2 is twice that of Zone 1 so it can be easy to overload the system during a long session.
Zone 3 intensity is used for pace or threshold sessions. Typical workouts include a 30 minute pace session or 3 x 10 minute intervals with 1-3 minutes rest in between. The intervals should be easy enough so that you can maintain your performance across the workout. The goal is to improve efficiency and recovery rates near the anaerobic threshold. This allows the body to learn to deal with greater amounts of lactate, effectively pushing the anaerobic threshold out further.
You need to be well rested for Zone 3 sessions. That means keeping your longer distance workouts in Zone 1.
Zone 4 is used to improve VO2 max and maximal aerobic work capacity. A typical workout is 4 or 5 intervals of 3 to 6 minutes each.
As with Zone 3 sessions, to have a quality Zone 3 workout requires not being too tired from doing long distance sessions at too high an intensity.
Zone 5 is rarely used - we don't really want to go anaerobic during a race! But you can do short all out sprints for speed training. By short, I mean 15 seconds...
(Planned daily workouts organized around training zones are part of the CXC Academy program that's included as part of the CXC Lower Michigan Junior Development and Master Program. You can also register for the training plans independently at the CXC Academy).
Summary
There are several important points to make.
First, you cannot use someone else's intensity zones as you own. The heart rates for Aet and AT for you could be very different than for someone else. You need to determine your own training zones. You cannot compare your heart rate at a particular intensity to someone else's.
Second, knowing your training zones greatly helps you target a workout for a specific cardio benefit. Too many skiers just "go hard" all the time and don't get the benefit of workouts that maximize training benefits at a certain intensity level. If you're always going "hard" then your not training to go "harder" - you won't be rested enough. Nor will you maximize long term structural changes in your cardio-respiratory and muscular systems while minimizing the impact caused by residual muscular fatigue on quality (zone 3 and 4) training sessions.
Third, using a sophisticated testing protocol like Cardio Coach, with the results interpreted by an experienced coach, will greatly aid in determining your training zones.
